I’m including this discussion because it may help you in writing your final project report. I suspect many of you already know this, but since the document exists, it seems worthwhile to post it.
If you produce your report using LaTeX (recommended!) the following example shows how
to include graphical images:
The main point here is that you need to use the graphicx package
\usepackage{graphicx, color}and that the command
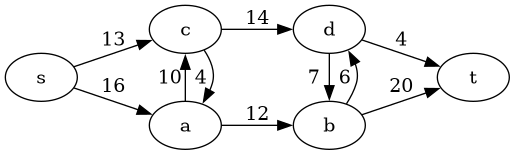
\includegraphics[scale=.5]{graph-example}displays the graphic found in the file named graph-example.png (or graph-example.jpg or…)
The [pdf] link above shows the output. To use this yourself, you’ll need
to save the latex file as well as the png graphic file. You can
read a bit more
here about
how to use this in overleaf. You’ll need to upload the relevant file
- in the above example, graph-example.png - to Overleaf in order to
use it there.